You can use the NGS 'Data Availabilty Plot' to see if there is
something wrong with the ingestion of data from the CORS station to
the NGS repository.For an example, assume
that we collected 4-hours of data near Wendover Nevada on Saturday
January 14, 2023 starting at 17:00 UTC and ending at 21:00 UTC.
Note: time zones
and daylight savings make GPS time and date telling very
difficult.
In the example
at hand, while Nevada is UTC - 8 hours, Wendover Nevada is in a
time zone cutout on Utah time (UTC - 7); additionally the annual
conversion from Mountain Standard Time (UTC - 7) to Mountain
Daylight Savings Time (UTC - 6) adds even more confusion.
The iGx Download
tool can help. On the configuration tab there is a 'Show UTC
Time' checkbox:
When dealing
with questions of CORS observation overlap, it will always be
easier to check this box and let your computer do the time zone
conversions, fully working in UTC instead of your local time
zone.
Browse to the NGS
CORS Map ( https://geodesy.noaa.gov/CORS_Map/ ) and zoom into the station
you want to inspect:, click on the station that you are interested
in:
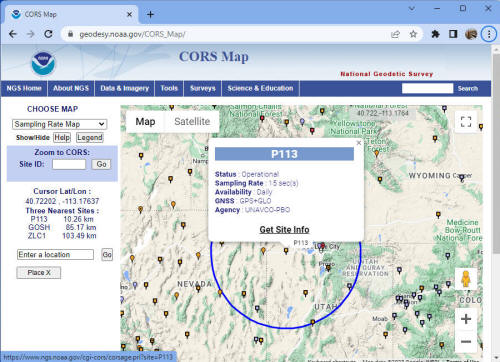
In this case, P113
is a nearby, very reliable UNAVCO PBO station. Click on 'Get Site
Info' link and a new tab will open in your browser showing station
details for P113:
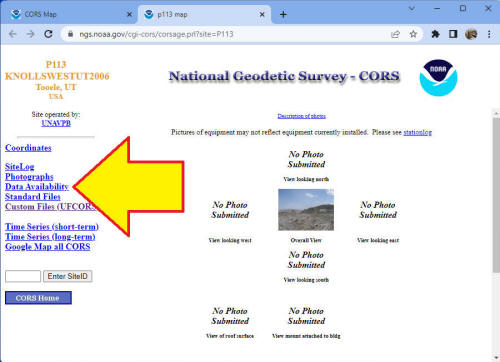
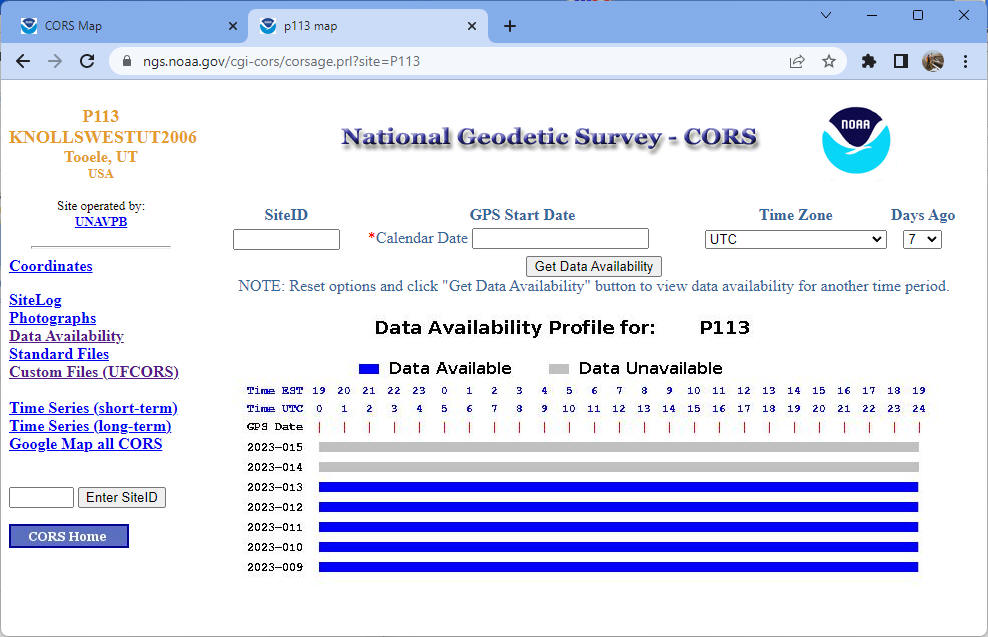
Click on 'Data
Availability' and the 'Data Availability Profile' for the selected
station will be shown.
To convert the
current day to a Julian count, click on the 'GPS Start Date' entry
box:
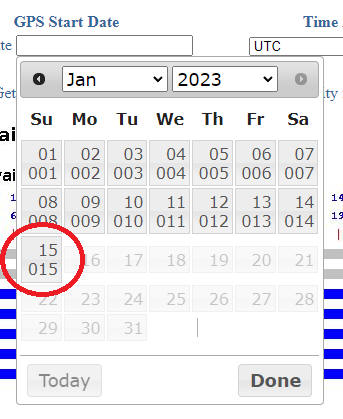
The current month
will be shown with the calendar day-of-month and the Julian
day-of-year. The Julian date (which is the 1-based incremental day
of the year) Saturday was Julian day 14.
Now, click outside
of the calendar to return to the availability timeline. Look at
Julian day 14:

You can see that day
14 is light-gray (not Blue) and there is currently no data available
for the P113 station, we will need to wait longer for P113 station
data overlapping our job to become available.
Predicting NGS CORS
Data Collection Time
You may be able to
predict the time of the future collection by looking at the
collection time of the previous day(s).
Go to the NGS HTTPS
CORS data bucket:
https://geodesy.noaa.gov/corsdata/
The root bucket will
be shown:
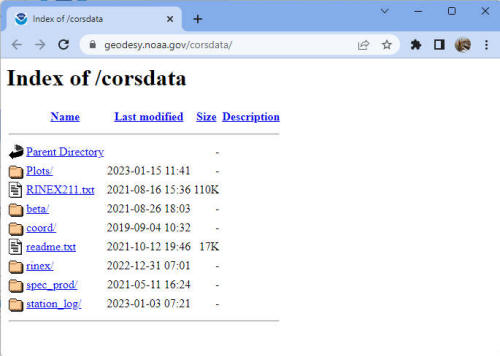
Click on rinex, then
the year (2023), then the previous Julian day (13), then the station
(p113):
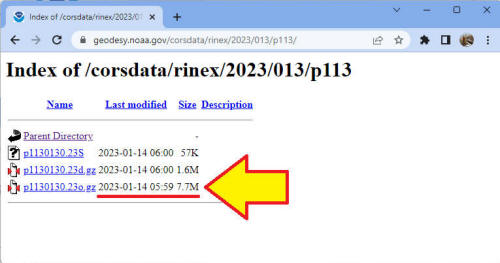
The observation data
(xxxx.23o.xx) was available for use at 5:59 UTC on the following
day, December 14th.
Checking Julian
day 12:
https://geodesy.noaa.gov/corsdata/rinex/2023/012/p113/
the availability time again was 5:59.
Checking Julian
day 11:
https://geodesy.noaa.gov/corsdata/rinex/2023/011/p113/
the availability time was 18:23. This is 12-hours after we might
have expected it to become available.
Summarizing three
weeks of availability data for P113:
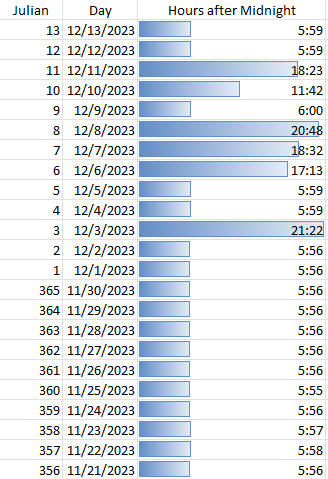
This is a good,
RELIABLE station. But sometimes you will need to wait an extra day
for data to become available.
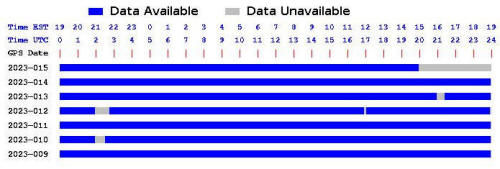
There are a few CORS
stations that are somewhat unreliable:
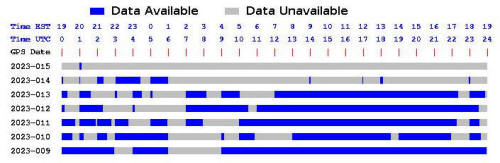
And others are
worthless:
If you use OPUS
regularly, you will soon develop a list of unreliable stations and
you can list them in the 'Exclude' box of the OPUS submission form.
|